


So you’ve spent countless hours analyzing traffic, channels, and conversions on Google Analytics; well done. Now
it’s time to take a step back from everything and take an objective
look at your content and its audience to see where they find the most
value.
Jay Castro, part of the Mobile Content Marketing team @ Google, has some great tips to get you started. Here’s what he says about refining up your content strategy with Google Analytics:Understand Who Your Audience Is
If your website has been live long enough (without being de-indexed or blocked for malicious practices), you will have some visitors.That’s your famous “15 minutes of fame” right there.
No matter how bad your content is, someone somewhere will be sifting through it for any reason under the sun (good or bad).
But do you know who that guy is?
Knowing who your audience is and what they like is key to creating better content that actually succeeds in converting visitors into loyal readers.
The first thing you see on Google Analytics is audience overview. If you take the time to dig a little deeper than the sessions, you can unearth some tasty bits of insights about your audience.
And I’m not talking about individual user reports in User Explorer. I am talking ‘broad spectrum’ audience analysis — age group, gender, and most importantly, interests based on browsing, search, and purchase activity.
Once enabled, Demographics and Interests reports are a goldmine of information about your audience.
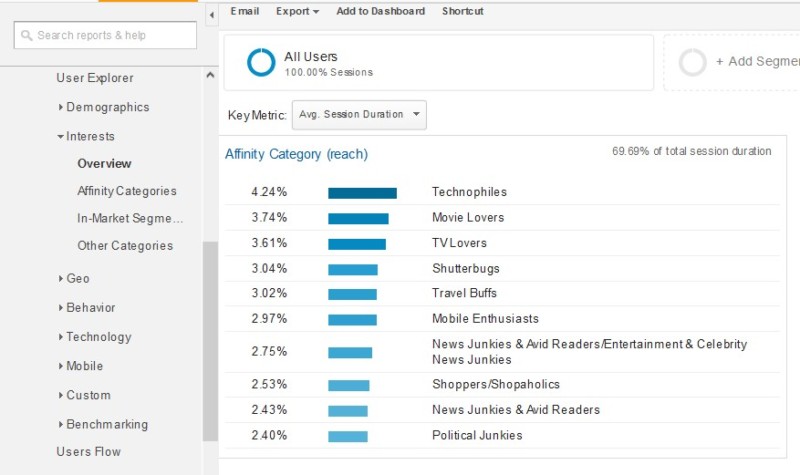
In Audience reports, go to Interests (1) >> Other Categories (2) (yup, the very same used in AdWords targeting!). Select a goal (3) and get cracking. For instance, here’s Google Merchandise Store’s Audience Interest Report (Goal: Engaged Users):
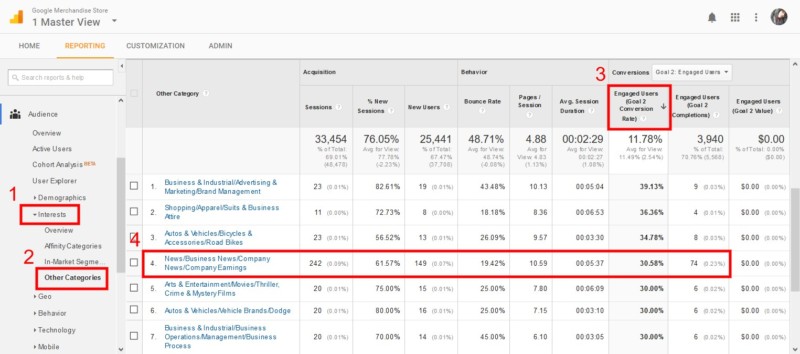
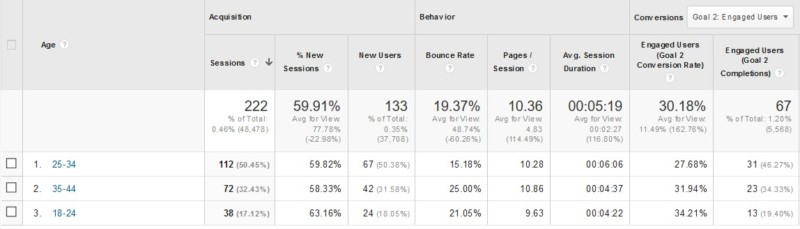
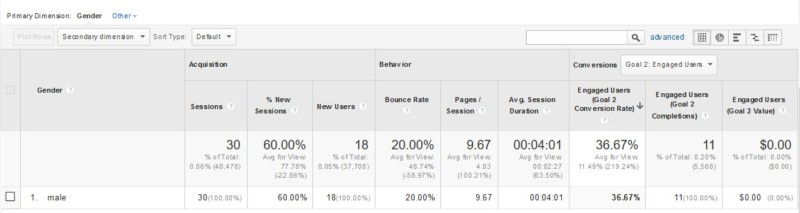
The granular category (News > Business News > Company News > Company Earnings) has some good numbers! But there’s more to be found when you click on the category name. You’ll see the audience with this interest segmented by age…
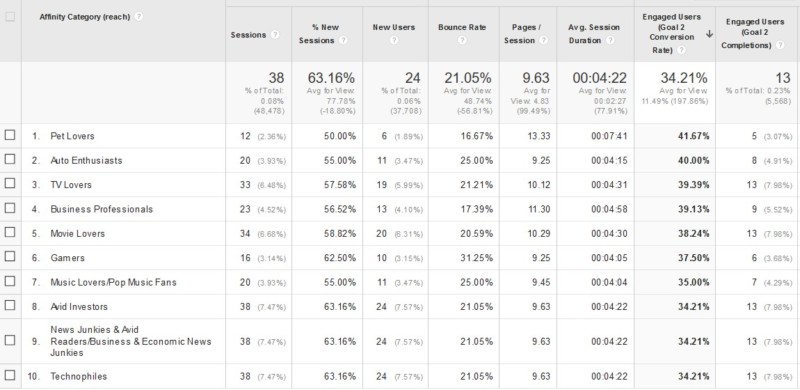
The last report (affinity categories) can be used to identify what this audience segment likes and responds to in general. See what I mean about delving deep?
Publishers with better things to do with their time than know their audience can get a broader view with interests overview. Here’s one based on avg. session duration (poor man’s substitute for ‘Engaged Users’ goal).
What can you do with this information?
Why, find out ways to incorporate these interest categories within your content strategy to increase your reach and engagement. Obviously.
Analyze Your Content for Performance
Content Grouping is, by far, the best (and most underrated) Analytics feature for publishers and bloggers everywhere. It lets you divide and bundle your published content in ways that make sense to you.Once you’ve bundled your content in groups, you get a simplified look at reports in every page and audience report, including Behaviour Flow (more on that in a moment). You can still drill down to individual pages (by page title or URL) for in-depth analysis.
Castro suggests you use this incredibly nifty feature to simplify content analysis so you can find, focus, and improve on:
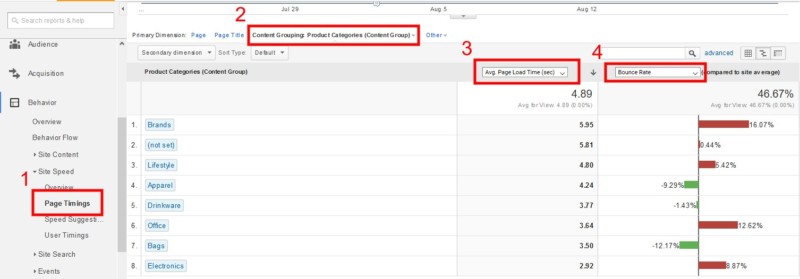
> Identify slow loading web pages
Page speed == User Experience is practically indisputable. And some of your content (for instance, posts with more images than general, infographics, video content, etc.) may be lagging behind.An easy way to identify these slow-pokes is: Group your content (here’s how) by type, author, topic/category, or any other parameter that seems logical to you. Then go to Behavior >> Site Speed >> Page Timings (1). You can segment the report by content groups as primary dimension (2).
Here’s an example from demo account that shows avg. page load time and bounce rate for content group: Product categories. Note how the group with highest avg. page load time (Brands) also has the highest bounce rate (16.07%):
> Identify pages with low AdSense CTRs
Group content by topic (WordPress users can go with categories taxonomy) and use the AdSense Pages Report (here’s how you link AdSense with Google Analytics). Use the AdSense Pages metric to compare content groups with lowest click-through-rates.Tip: Drill down to individual pages within lowest CTR pages. Focus on increasing acquisition with SEO and Social shares directed specifically to these pages.
We also suggest you find out and monetize upon content groups that have:
- Engagement (high values for behaviour metrics — avg. session duration, page depth, pageviews, and returning visitors)
- Social shares/mentions (Set-up analytics for social plugins or simply use this brilliant dashboard by Justin Cutroni, available in Solutions Gallery)
Learn How Visitors Navigate Your Site
Your visitors enter, navigate, and leave your site in ways you probably never thought about. Here’s how you can decode the navigation patterns on your site.> Landing Page Report
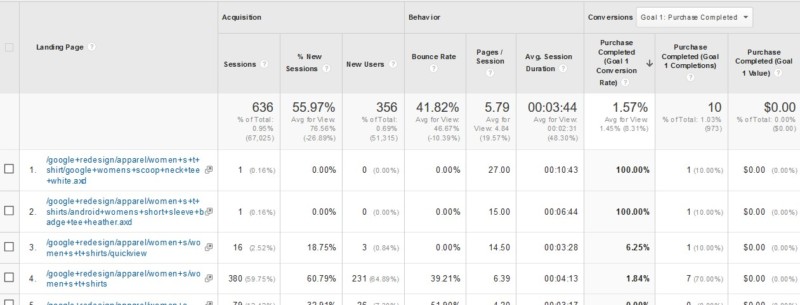
To Google Analytics, ‘landing page’ means a visitor’s point of entry to your site. Go to Behaviour >> Site Content >> Landing Pages (1). Here’s what Demo Account landing page report says about Google Merchandise store (primary dimension — content group: clothing by gender(2))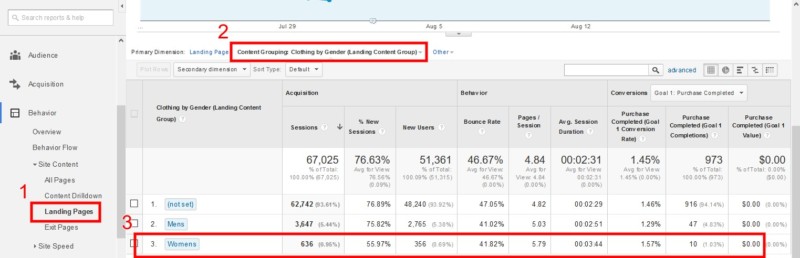
- Reverse Goal Path: Analyse content that helps conversions (2nd and 3rd landing pages) and use it to funnel audience towards completion of primary website/blog goals with internal linking
- Behaviour Flow: Find out how visitors arrive and move across your website.


0 comments:
Post a Comment